
Tuesday: International Trade, ISM Non-Mfg. Index
Wednesday: ADP Employment Report, Productivity and Costs, Janet Yellen Speaks 9:15 AM ET, EIA Petroleum Status Report
Thursday: Jobless Claims
Friday: Employment Situation
HEADLINES:
Weekly jobless claims plummet. The number of Americans filing new claims for unemployment benefits, an indicator of layoffs, fell to the lowest level since 2000. These numbers suggest that the weak March jobs report was a seasonal aberration.[8]
April consumer sentiment at 2nd highest level since 2007. A monthly indicator of consumer sentiment rose last month as Americans became more optimistic about current and future conditions. Though consumers are worried about interest rates, they are more confident about jobs and income prospects.[9]
Motor vehicle sales driven by trucks and SUVs. Cheap gas appears to have reignited Americans' love affair with big vehicles; though April is typically a slow month for auto sales, demand for sport-utilities and trucks accounted for about half of April's sales.[10]
Manufacturing growth slows in April. Though the manufacturing sector is growing, the pace of growth fell last month to the slowest pace in almost two years. Though new orders are up (a good sign for future growth), employment is down to its lowest level in five years.[11]
Investing involves risk including the potential loss of principal. No investment strategy can guarantee a profit or protect against loss in periods of declining values.
Diversification does not guarantee profit nor is it guaranteed to protect assets.
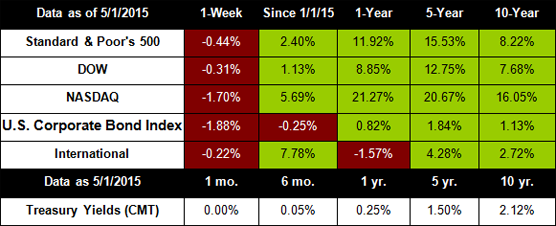
The Standard & Poor's 500 (S&P 500) is an unmanaged group of securities considered to be representative of the stock market in general.
The Dow Jones Industrial Average is a price-weighted average of 30 significant stocks traded on the New York Stock Exchange and the NASDAQ. The DJIA was invented by Charles Dow back in 1896.
The Nasdaq Composite is an index of the common stocks and similar securities listed on the NASDAQ stock market and is considered a broad indicator of the performance of stocks of technology companies and growth companies.
The MSCI EAFE Index was created by Morgan Stanley Capital International (MSCI) that serves as a benchmark of the performance in major international equity markets as represented by 21 major MSCI indexes from Europe, Australia and Southeast Asia.
The Dow Jones Corporate Bond Index is a 96-bond index designed to represent the market performance, on a total-return basis, of investment-grade bonds issued by leading U.S. companies. Bonds are equally weighted by maturity cell, industry sector, and the overall index.
The S&P/Case-Shiller Home Price Indices are the leading measures of U.S. residential real estate prices, tracking changes in the value of residential real estate. The index is made up of measures of real estate prices in 20 cities and weighted to produce the index.
The 10-year Treasury Note represents debt owed by the United States Treasury to the public. Since the U.S. Government is seen as a risk-free borrower, investors use the 10-year Treasury Note as a benchmark for the long-term bond market.
Opinions expressed are subject to change without notice and are not intended as investment advice or to predict future performance.
Past performance does not guarantee future results.
You cannot invest directly in an index.
Consult your financial professional before making any investment decision.
Fixed income investments are subject to various risks including changes in interest rates, credit quality, inflation risk, market valuations, prepayments, corporate events, tax ramifications and other factors.